Objective 2: Distinguish between intermolecular and intramolecular forces.
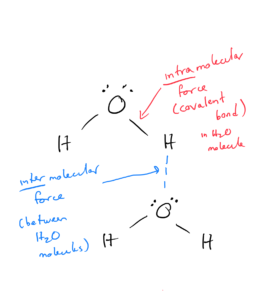
Intramolecular forces are chemical bonds. They are the bonds (ionic, polar, and covalent) we have been looking at throughout the class. They exist within the molecule.
Intermolecular forces are forces of attraction between 2 or more molecules or atoms. They are weaker than bonds (intramolecular forces). Even though they are weaker than bonds, they are still strong enough to control physical properties such as boiling and melting points, vapor pressures, and viscosities.
The following picture illustrates the difference between intermolecular and intramolecular forces, using water as an example:
In an element such as helium that does not exist as atoms, the term “intermolecular” is still used, and the force is between helium atoms:
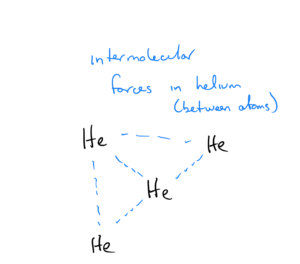
Intermolecular forces are the forces that causes gas molecules to form solids or liquids if cooled sufficiently. Let’s look at water and helium as examples. At 1 atm pressure, the boiling point of water is 100ºC (373 K) That means liquid water must be heated to 373 K before the molecules have the energy needed to break the intermolecular forces and boil, or steam must be cooled to 373 K to condense to a liquid. At the same pressure, helium has a boiling point of 4 K – meaning liquid helium only has to be heated to a temperature of 4 K to break the intermolecular forces and boil. Given this info, do you think the intermolecular forces of helium or water are stronger?
This illustrates the higher the boiling point of a liquid, the stronger the intermolecular forces for the substances. Stronger forces means a higher temperature (more kinetic energy) is needed to break the intermolecular forces to the extent needed to go to the gas phase.
Objective 1: Explain the origin of the various types of intermolecular forces and indicate the kinds of intermolecular forces expected for a substance given its molecular structure.
There are three general types of intermolecular forces (as we will see, there are actually only two, with the third being a special case of one of the other two). They are:
- Dipole-dipole forces
- Hydrogen bonding
- London dispersion (induced dipole) forces
A substance can have more than one of these types. The molecular structure and polarity of the substance will determine the type(s) and relative strength of the forces the substance has. Next, we’ll look at each type.
Dipole – Dipole Forces
Dipole-dipole forces are present in polar molecules. Any molecules that have permanent dipoles are attracted to each other. The positive end of one is attracted to the negative end of the other and vice-versa. These forces are more important for behavior as molecules get closer together.
HCl is a polar molecule, with the more electronegative chlorine being partially negative and the hydrogen being partially positive:
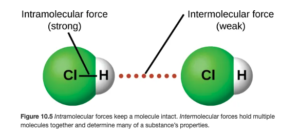
As seen above on OpenStax Figure 10.5, the intermolecular force (illustrated by the red dots) is between the hydrogen on one molecule and the Cl on an adjacent molecule.
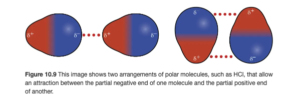
OpenStax Figure 10.9 also illustrates dipole-dipole forces – again, notice they are between a δ+ on one molecule and a δ- on another molecule:
If a molecule is polar, the substance has dipole-dipole forces. How do you tell if a molecule is polar? By considering the molecular shape and geometry and electronegativity difference. This was covered in Unit 3 – you can review it in the Bruce’s Notes on molecular geometry and bonding theory.
Hydrogen Bonding
Hydrogen bonding is a special case of dipole-dipole forces – they are especially strong dipole-dipoles. It requires a molecule in which hydrogen is bound to a highly electronegative atom (usually N,O,or F). HF, NH3 and H2O, and alcohols are examples.
Why H? The small hydrogen atom can get close to an adjacent molecule. Why N,O, or F? These atoms all have high electronegativities. The highly electronegative N,O, or F atom means a strong dipole with H. They work just like dipole-dipole, but are stronger than you might otherwise expect for a dipole-dipole intermolecular attraction. That said, hydrogen bonding is NOT A CHEMICAL BOND like ionic, polar, and covalent bonds. The word “bond” is used since they are strong for intermolecular forces. They are still quite weak compared to covalent bonds within a molecule.
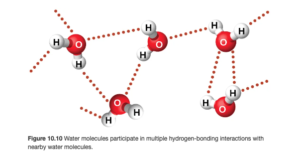
The figure below (OpenStax Figure 10.10) illustrates hydrogen bonding in water. The hydrogen bonds are illustrated by the red dots and are between the δ+ hydrogen on one molecule and the δ- hydrogen on another molecule.
Hydrogen bonding can also occur in ammonia (NH3), since it has the highly polar H-N bond:

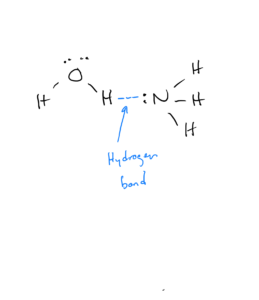
Any molecule that can hydrogen bond can have a hydrogen bond with any other molecule that can hydrogen bond. For example, ammonia can hydrogen bond with water:
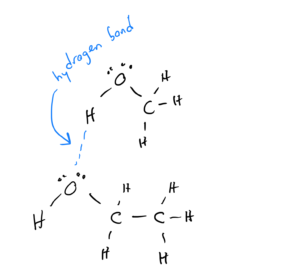
Alcohols are compounds in which carbons bonded to each other and to hydrogens replace one of the hydrogens in water. They have the formula CxHyOH. Because they have an O-H bond, they can hydrogen bond:
London Dispersion (LD) Forces
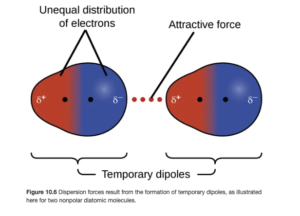
In London Dispersion Forces (also called Induced Dipoles) a momentary misbalance of charge (temporary dipole) around atoms can occur as electrons move around the atom or molecule, forming a small, temporary dipole. The excess electrons on one side can repel electrons to the opposite side of an adjacent atom or molecule, inducing dipoles in surrounding particles. The attractive forces caused by these temporary dipoles are London dispersion forces. They are typically weaker than dipole-dipole forces and hydrogen bonds. Figure 10.6 in OpenStax illustrates this:
LD forces operate between all molecules (or individual atoms in elements) whether they are polar or nonpolar. They are the only intermolecular force between nonpolar atoms and molecules. Polar molecules experience dipole-dipole forces in addition to London dispersion forces. Therefore, while polar molecules have both LD and dipole-dipole forces, the dipole-dipole are the dominant intermolecular force because they are stronger. London Dispersion forces are the dominant forces in elements and nonpolar compounds because they are the only intermolecular force in these.
Strength of London Dispersion Forces
In general, the larger the atom or molecule, the stronger its LD forces. Larger atoms and molecules have more electrons and larger electron clouds (valence electrons further from nucleus). These larger electron clouds are easier to move around, resulting in larger and more persistent charge imbalances and stronger induced dipole forces. Table 10.1 OpenStax illustrates this – as the boiling points increase for the diatomic halogens as you go down the column from F2 to At2. Recall higher boiling points mean stronger intermolecular forces.
Also, the shape of the molecule affects the strength of dispersion forces: long, skinny molecules tend to have stronger dispersion forces than short, fat ones, even with the same molar mass. For example, consider the three forms of C5H12 as shown in OpenStax Figure 10.7:
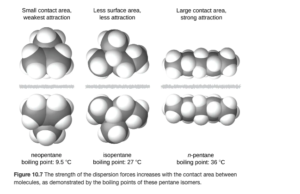
The molecule on the right (the longer chain) has stronger LD forces as a stronger induced dipole can be built up over the long chain.
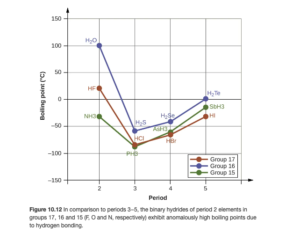
Figure 10.12 in OpenStax (and the discussion in the text around it — read it) provides a good illustration of intermolecular forces. Looking at the blue line on the figure, you can see that going from H2S to H2Se to H2Te , boiling point increases, meaning that intermolecular forces get stronger. This is to be expected due to the larger molar mass and LD forces. However, H2O, though smaller than all three of theses compounds, has the highest boiling point. Why? Hydrogen bonding. Similar trends are seen for series beginning with HF and NH3.
Objective 1 Practice
Objective 3: Explain the terms viscosity, surface tension, capillary action, meniscus, adhesion, and cohesion.
In liquids, the particles have a constant volume, but no fixed shape; they take the shape of the container. Therefore, the particles can move past each other. The strength of the attractions between molecules affects properties of the liquid. Three examples of properties of liquids affected by the strength of intermolecular forces are surface tension, capillary action, and viscosity.
Surface Tension
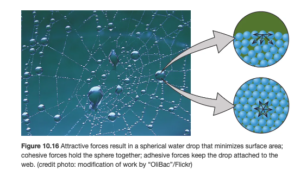
Surface tension results from the tendency of liquids to minimize their surface area. In the figure below (OpenStax Figure 10.16), molecules in the interior are attracted equally in all directions; molecules on the surface experience a net inward force. As a result, the layer of molecules on the surface behave differently than the interior, which acts like an elastic skin.
Surface tension increases with the strength of intermolecular forces (stronger intermolecular forces mean higher surface tension). Surface tension is also higher at lower temperature.
Capillary Action
Capillary Action is the ability of a liquid to flow up a thin tube against the influence of gravity. It results from two types of intermolecular forces:
- cohesive forces (intermolecular forces between liquid molecules)
- adhesive forces (intermolecular forces between the liquid molecules and tube)
The adhesive forces pull the surface liquid up the side of the tube, while the cohesive forces pull the interior liquid with it. The liquid rises up the tube until the force of gravity counteracts the capillary action forces. The relative strengths of the cohesive force and the adhesive force determine the height and direction of the meniscus at the liquid surface in the tube. This is discussed in more detail in OpenStax Figure 10.20 and the surrounding text.
Viscosity:
Resistance of a liquid to flow is called viscosity. It is related to the ease with which molecules can move past each other. We tend to think of liquids that have a high viscosity as “thick”. Examples include molasses, honey, some oils, etc. An extreme example of a highly viscous liquid is the pitch drop experiment, where a single drop of the highly viscous pitch takes several years to fall!
Stronger intermolecular attractions means larger viscosity. Viscosity also increases with molecular weight, as larger, more complex molecules tend to “tangle” on a molecular level, reducing their ability to flow. Viscosity also increases as temperature decreases.
Objective 4: List the different phase changes and identify them as endothermic or exothermic.
Phase changes are transformations from one phase to another. Most of these changes correspond to terms you may well be familiar with. Remember going from solid to liquid to gas requires energy (so is endothermic) while gas to liquid to solid is exothermic
Endothermic phase changes:
Melting: solid → liquid
Vaporization: liquid → gas
Sublimation: solid → gas
I suspect melting is familiar to you. For the liquid to gas phase change, you may think of the words boiling or evaporation. These are both forms of vaporization. Sublimation may be the least familiar to you — it is a phase change going directly from solid to gas, bypassing liquid altogether. At the pressures we live at (around 1 atm) carbon dioxide sublimates — that’s why solid carbon dioxide is called dry ice – it doesn’t melt to form a wet liquid before going to gas!
Exothermic phase changes:
Freezing: liquid → solid
Condensation: gas → liquid
Deposition: gas → solid (the opposite of sublimation)
Objective 5: Solve problems involving enthalpies of fusion and vaporization.
Calculating energy involved in phase changes between solid and liquid
The heat of fusion (ΔHfus) is defined as the enthalpy change associated with melting or freezing one mole of substance at the melting or freezing point. We use heat of fusion to calculate energy change of state changes between solid and liquid. Note it is at the melting or freezing point – so the temperature does not change.
Remember, melting is endothermic, so heat is required. The heat of fusion is the heat required to melt one mole of the substance.
Also, freezing is exothermic, so heat is released. The heat of fusion is the heat released when freezing one mole of the substance.
The calculations for melting or freezing are the same – the only thing that changes is whether the heat is required or released.
Calculating energy involved in phase changes between liquid and gas
These calculations are the same as calculations for solid ↔ liquid phase changes, except they use heat of vaporization.
Heat of Vaporization (ΔHvap) is defined as the enthalpy change associated with vaporizing or condensing one mole of substance at the boiling point and a pressure of one atm. We use it to calculate energy change of state changes between vapor and liquid. Note it is at the boiling point – so the temperature does not change.
Remember, vaporizing is endothermic, so heat is required. The heat of vaporization is the heat required to boil or evaporate one mole of the substance.
Also, condensing is exothermic, so heat is released. The heat of vaporization is the heat released when condensing one mole of the substance.
The calculations for vaporizing or condensing are the same – the only thing that changes is whether the heat is required or released.
Objective 5 example
Calculate the energy required to melt 27.0 g ice at a temperature of 0.0°C. The heat of fusion for H2O is 6.02 kJ/mol.
We can think through this problem logically and using dimensional analysis, and no equation is required. We know the heat of fusion gives us the energy required for one mole, so if we conver the grams of water to moles to detemine the number of moles we have, we can then just multiply the number of moles by the heat of fusion. Heat of fusion will act as a conversion factor in dimensional analysis:

Alternatively, we can think of this as an equation in which the heat energy (q) is obtained by multiplying the number of moles times the heat of fusion in kJ/mol:

where
- q is the heat required to melt or released to freeze
- n is the number of moles
- ΔHfus is the heat of fusion
Solving the same problem, we could calculate the number of moles then use the equation:


Similarly, for heat of vaporization the equation would be 
ΔH Calculations for Heating and Cooling Substances
When adding or removing heat from a substance, there are two types of calculations used, depending on what is occurring:
- A phase change while the temperature stays constant. If vaporization or condensation occurs the temperature stays at the boiling point temperature until the phase change is complete. If melting or freezing occurs the temperature stays at the freezing point temperature until the phase change is complete. When this occurs, the calculations are the heat of fusion or heat of vaporization calculations just covered.
- The temperature changes while the phase stays constant. You learned these calculations earlier in the semester using the concept of specific heat (Cs). Specific heat is defined as the amount of energy required to raise the temperature if 1 gram of a substance by 1 degree Celsius (or 1 degree K). You must be careful to use the specific heat for the correct phase – the specific heat for a solid, liquid and gas of the same substance is not the same. If you need a review of specific heat calculations, see objective 6 in the Bruce’s Notes for Thermochemistry.
What happens when both the phase and temperature change?
You cannot calculate energy for both temperature and phase changes in a single calculation. If both occur, you must break the calculation up into multiple steps, each of which is either a heat of vaporization, a heat of fusion, or a specific heat calculation. Let’s look at an example next:
Calculate the heat required to convert 9.0 g ice at -5.0 degrees C to water at 20 degrees C. Given:
- Specific heat of H2O (s) = 2.1 J/g·ºC
- Specific heat of H2O (l) = 4.2 J/g·ºC
- Specific heat of H2O (g) = 2.0 J/g·ºC
- ΔHvap of H2O = 40.7 kJ/mol
- ΔHfus of H2O = 6.02 kJ/mol
This problem must be broken into three steps:
- Temperature change of solid from -5.0 degrees C to zero degrees C.
- Phase change at zero degrees C – melting of solid ice to liquid water
- Temperature change of solid from zero degrees C to 20 degrees C.
Step 1:
Since it is a temperature change for solid ice, a specific heat calculation is done:

Step 2:
Since it is a phase change (melting) at a constant temperature of zero degrees C, a heat of fusion calculation is done:

Step 3:
Since it is a temperature change for liquid water, a specific heat calculation is done:

The total heat required is obtained by adding up the values from all the steps. Specific heat calculations are typically in J and phase changes are typically in kJ. They must either be all on J or all in kJ to add.
0.095 kJ + 3.01 kJ + 0.756 kJ = 3.86 kJ
A common question is why can’t just one calculation for the temperature change be done for the entire temperature change from -5.0 degrees C to 20 degrees C? The reason it cannot is that there are two different phases at those temperatures, and the specific heat is not the same for the solid and the liquid. Therefore, separate temperature change calculations must be done for each phase and the separate results added together.
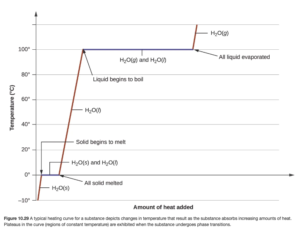
These problems are often shown pictorially in what is called a “heating curve” (see OpenStax Figure 10.29). In the example above, over the temperature range of -5 to 20 degrees C, three lines (two red and one blue) are encountered representing the three steps to the calculation. Heating curve calculations can have up to five steps (if going from a solid below the freezing point to a gas above the boiling point).
Objective 5 practice
The following data can be used in the three practice problems below:
- Specific heat of H2O (s) = 2.1 J/g·ºC
- Specific heat of H2O (l) = 4.2 J/g·ºC
- Specific heat of H2O (g) = 2.0 J/g·ºC
- ΔHvap of H2O = 40.7 kJ/mol
- ΔHfus of H2O = 6.02 kJ/mol
Objective 6: Describe how the vapor pressure of a substance is affected by temperature and intermolecular forces of attraction.
Intermolecular Forces and boiling point/melting point temperatures
The stronger the intermolecular forces of a substance, the higher the temperature at which its liquid boils. The molecules of a liquid must overcome the attractive forces to separate and form a vapor. The situation is similar for melting points: the stronger the intermolecular forces, the higher the melting point of a solid.
Vapor Pressure
Imagine you have a liquid in a partially filled, closed container. Some of the liquid molecules escape into the space above the liquid, going into the vapor phase. These molecules exert a pressure. This pressure caused by a vapor present at equilibrium above the liquid in a closed container is the vapor pressure. Figure 10.22 in OpenStax (shown below) illustrates vapor pressure.
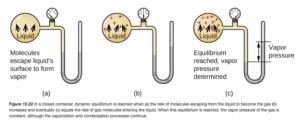
For a given liquid, the higher the temperature, the more molecules can escape to the vapor phase. More molecules in the vapor phase mean more pressure. Therefore, vapor pressure increases with temperature. For many common liquids, vapor pressure is known as a function of temperature. For example, Table E2 in OpenStax Appendix E lists vapor pressure for water at various temperatures.
At the same temperature, some liquids have a higher vapor pressure than others. For example, gasoline has a higher vapor pressure than water at the same temperature. A liquid is more volatile if it has a higher vapor pressure at a given temperature, so gasoline is more volatile than water. The stronger the intermolecular forces in a liquid, the lower the vapor pressure as it is more difficult for molecules to escape into the vapor phase. Since stronger intermolecular forces are also associated with higher boiling points, the lower the vapor pressure (the less volatile the liquid) the higher its boiling point.
Objectives 7 and 8:
7. Understand the factors that influence the rate of evaporation and the relationship between boiling and evaporation.
8. Define boiling point and normal boiling point and know the effect of pressure, intermolecular forces, and molar mass on each.
Vaporization is a phase change from liquid to gas. There are two ways this occurs — evaporation and boiling.
Evaporation
Evaporation occurs over an open container or body of liquid at a temperature below the boiling point temperature (think about it — water evaporates in our daily lives and the temperature is never 100°C! Take a look at this video on evaporation to see how it works:
Boiling
Boiling occurs at temperatures where the vapor pressure of a liquid is equal to outside surrounding (usually barometric) pressure. What does that mean? Let’s consider vapor pressure data for water (from OpenStax Appendix E):
| Temperature (°C) | Vapor Pressure (torr) |
|---|---|
| 80 | 355.1 |
| 85 | 433.6 |
| 90 | 525.8 |
| 95 | 633.9 |
| 100 | 760.0 |
Notice that (as you learned earlier) vapor pressure increases as temperature increases.
Let’s say that the barometric pressure outside one day is 760.0 torr (1 standard atmosphere). Water will not boil at 95 °C because its vapor pressure of 633.9 torr is lower than the barometric pressure of 760.0 torr. Its temperature must be raised to a minimum of 100 °C to boil (it will also boil at temperatures greater than 100 °C)
Now let’s consider we are in a mountainous or higher elevation area, at an elevation of 5000 ft. The barometric pressure will be lower (a realistic number is around 630 torr). If the barometric pressure that day was 630 torr, water would boil at 95 °C as the vapor pressure of 633.9 exceeds 630 torr, so the vapor pressure can overcome the barometric pressure. That’s why it takes longer to cook food by boiling at altitude – the boiling water is not as hot as it is at sea level!
Pressure cookers work by this principle as well. A pressure cooker operating at temperature of 2 atmospheres would result in a boiling point temperature significantly hotter than 100 °C, allowing food to be surrounded by very hot water.
Even though the boiling point of water (and all liquids) depends on the outside barometric pressure, we usually think of it as being 100 °C. This is actually the normal boiling point, which is the temperature where vapor pressure = 1 atm. We often assume that value as the boiling point. This is a reasonable assumption here in Michigan, where the barometric pressure is usually pretty close to 1 atm.
Objectives 7 and 8 Practice
Objectives 9 and 10
9. Given the critical temperature and pressure of a substance, describe the conditions necessary to convert it from a gas to a liquid.
10. Use a phase diagram to determine the physical state of a substance.
A phase diagram is a graphical representation of the phases of a substance as a function of temperature and pressure. It consists of regions that represent different phases exhibited by a substance. Each region corresponds to range of combinations of T and P over which that phase is stable. Figure 10.30 in OpenStax is an example of a phase diagram:
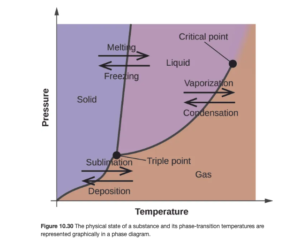
If you know the temperature and pressure of a substance, you can look at the diagram and see what phase it will be in. The lines on the diagram exhibit places where more than one phase exists at equilibrium – and crossing that line (by adjusting T or P) results in the phase change. The freezing (or melting) point line or curve is the line between solid and liquid and gives the freezing points at various pressures. The boiling point line or curve (also called the vapor pressure curve) is the line between gas and liquid and gives the boiling points at various pressures (or the vapor pressures at various temperatures).
Figure 10.31 in OpenStax is a phase diagram for water. It illustrates the normal melting point and normal boiling point — which are the points in the melting point and boiling point curves at a pressure of 1 atm (101 kPa on the picture).
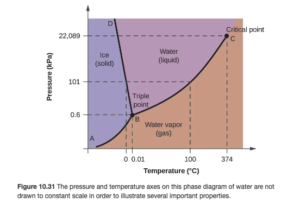
Other points include the triple point (where solid, liquid, and gas all meet — all three phases coexist at equilibrium at the triple point) and the critical point. The critical point consists of the critical temperature and critical pressure.
The critical temperature is the highest temperature at which a liquid can exist. At the critical temperature or higher temperatures, the gas cannot be condensed to a liquid, no matter how high the pressure gets. The critical pressure is the pressure required to liquefy AT the critical temperature.
Above this critical temperature and critical pressure the liquid and vapor are indistinguishable from each other, forming a supercritical liquid.
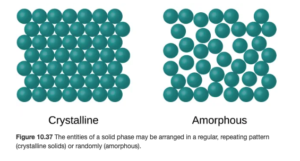
Objective 11:Distinguish between crystalline and amorphous solids and give an example of each.
We looked at the liquid phase earlier. Now, we’ll close out this topic with a closer look at the solid phase. In a solid, all atoms or molecules are frozen or locked in place, though they will vibrate slightly unless at a temperature of absolute zero. In most solids, the atoms are arranged in a definite, regular repeating pattern, These solids are called crystalline solids. In other solids, the atoms are not arranged in an ordered pattern. Solids with a random arrangement of atoms are amorphous solids. OpenStax Figure 10.37 illustrates both:
Crystalline Solids
In crystalline solids, the key word is organization. They have a regular arrangement of repeating units. They have definite, well defined melting points – you can go online and find a precise melting point for many solids. They can be cut or cleave along straight lines (unlike amorphous) – think gemstones like diamonds.
Amorphous Solids
Amphorous solids are highly unorganized or disordered. Rather than having precise melting points, they melt over a large temperature range. They exhibit flow and viscosity. Glass is an example of an amorphous solid.
Objective 12 Define unit cell and describe the number of atoms and their location in a simple cubic (primitive cubic), body-centered cubic and face-centered cubic unit cell.
Unit Cell
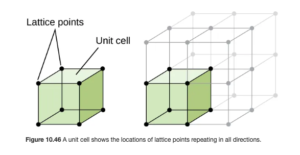
The smallest repeating structure of a crystalline solid is known as the unit cell. A crystalline solid can be represented by a three dimensional array of points called a crystal lattice. You may have heard the term lattice before referring to a fence or a pie crust — a lattice fence and a lattice pie crust both contain repeating patterns. Figure 10.46 in OpenStax (shown below) illustrates a unit cell in a crystal lattice.
Cubic Unit Cells
The lattice and unit cell shown above is a simple cubic or primitive cubic structure. The unit cells are cubes stacked one on top and on each side of the other. In this structure, an atom is at each point represented by a dot (called the lattice points) above, as illustrated in OpenStax Figure 10.47:
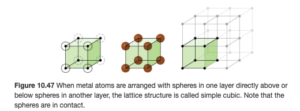
In the simple cubic structure, the lattice points are at the corner of each unit cell cube.
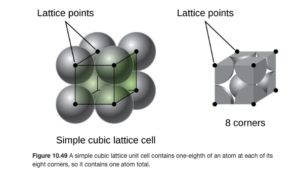
Number of atoms in a simple cubic unit cell
If you were to asked to determine the number of atoms in a simple cubic unit cell, a logical answer would seem to be 8. But 8 would be incorrect. If you consider an atom at the corner of a unit cell in a simple cubic lattice, that atom is actually at the border of eight different unit cells. Therefore, only 1/8 of the atom at a corner is in a single unit cell. Since there are eight corners with 1/8 atom in each, the unit cell contains a net total of one atom. This is illustrated in OpenStax Figure 10.49
Body-centered cubic structure
A body centered cubic is similar to a simple cubic, but it has an additional atom in the center of the cube (OpenStax Figure 10.51):
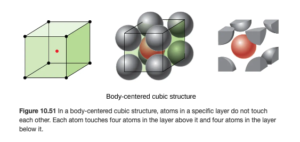
The body centered cubic contains two atoms per unit cell: the atom in the center resides entirely in that cell for one, and the corners provide 1/8 atom each as in the simple cubic:
Face-centered cubic structure
A face centered cubic is similar to a simple cubic, but it has an additional atom on each of the six sides of the cube (OpenStax Figure 10.52):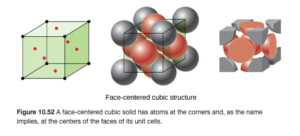
The face centered cubic contains two atoms per unit cell: on each of the six sides, the atom is shared between two unit cells, and the corners provide 1/8 atom each as in the simple cubic:
(8 Χ 1/8) + (6 Χ 1/2) =4
So there are four atoms per unit call in the face-centered cubic structure.
This ends our coverage for liquids and solids. In our next (and last) topic this semester, we will look at additional properties of solutions beyond what you learned about in Unit 2.