Acid-Base Titration Setup
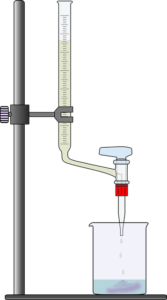
A typical acid base titration is shown in the figure below. The burette is used to slowly dispense the titrant solution into the Erlenmeyer flask. The graduations on the burette allow measurement of the volume of titrant dispensed into the flask.
In the acid base titrations we will consider in CHEM 152, the titrant (in the burette) will either be a strong acid or a strong base. The analyte (the solution in the flask) can be a weak acid, a weak base, a strong acid, or a strong base.
Titrations are described by saying that “the analyte is titrated with the titrant”. As an example, in a titration of a strong acid with a strong base, the acid would be in the flask and the base would be in the burette. Since the base is in the burette, we would say that we are titrating the acid with the base, not that we are titrating the base with the acid. It follows that there are four types of acid-base titrations (these four do not include polyprotic acid titrations, which are NOT covered in CHEM 152).
Objective 20: Define titration, titration curve, indicator, end-point, equivalence point and mid point (half-equivalence point).
Objective 21:Sketch a titration curve and identify various points on the curve.
Objective 22:Calculate the pH at various points along a titration curve for a strong acid with a strong base, strong base with a strong acid, weak acid with strong base or weak base with strong acid given the volume of the titrant and the concentration of the components.
Titration Curves
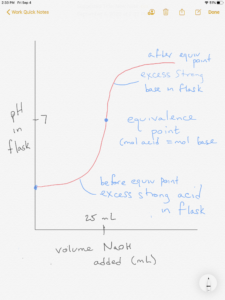
An acid-base titration curve is shown in the figure below:
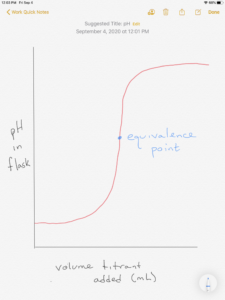 In an acid-base titration curve, the volume of titrant added to the flask is plotted on the x-axis and the pH in the flask is the y-axis. The shape of the curve shown is typical when the flask pH is plotted as a function of titrant added to the flask. The equivalence point can be found at the middle of the steeply sloped portion of the curve. The equivalence point is reached when exactly enough titrant has been added to react with the analyte. If the reaction stoichiometry is 1 mole acid to 1 mole base (example: HCl + NaOH → NaCl + H2O) then the equivalence point is reached when moles of acid = moles of base.
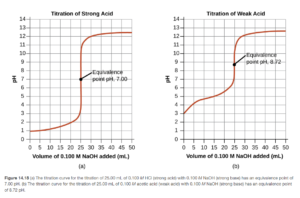
Two typical titration curves are shown in Figure 14.18 OpenStax. One is for a strong acid with a strong base, the other is for a weak acid with a strong base. You can tell that the two curves in the OpenStax link and the figure above are titrations of an acid with a base since the starting pH is low (due to the acid in the flask). The pH increases as base is added from the burette (going left to right).
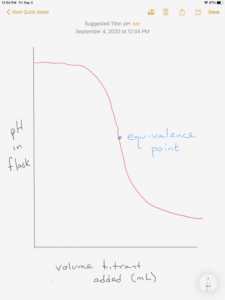
The figure below shows a titration curve for the titration of a base with an acid. Notice the starting pH is high and decreases as acid is added.
Strong Acid-Strong Base Titrations
The figure below shows the titration of a strong acid with a strong base:
Combining calculations you have learned previously, you should be able to calculate the flask pH at any point in this titration. There are basically four types of calculations or “zones” on the titration curve:
- Starting (initial) point
- Before the equivalence point has been reached
- The equivalence point
- After the equivalence point
The following example will illustrate the four possible types of calculations.
Example: Titration of a strong acid with a strong base
For a titration of 50.0 mL of 0.050 M HCl with 0.10 M NaOH, calculate pH:
- at 0.00 mL NaOH addition
- at 10.00 mL NaOH addition
- at 25.00 mL NaOH addition
- at 30.00 mL NaOH addition
Before starting, you need to realize what solution is in the flask to calculate flask pH. Since it is a titration of HCl with NaOH, the HCl is in the flask initially.
0.00 mL NaOH addition – before any NaOH is added, there is 0.050 M of strong acid HCl in the flask. For a strong acid, the HCl molarity = [H+]=0.050. Therefore, pH = -log [0.050] = 1.30
Once NaOH is added, a three step process is needed to calculate flask pH:
- Write the neutralization reaction of the titrant with the analyte
- Determine the contents of the flask using stoichiometry of the neutralization reaction (uses moles; looks like an ICE table but it is not!)
- Determine pH of the flask contents. (this will be a calculation you learned earlier in the unit)
Hopefully this process looks familiar – it is the same process used in our previous topic of calculating pH when a strong acid or a base was added to a buffer solution.
Let’s look at this process for the 10.00, 25.00, and 30.00 NaOH volumes:
10.00 mL NaOH addition
Step 1: Write the equation for the neutralization reaction between the acid and the base. It will be easiest to work in net ionic equations. As a strong acid, HCl will dissociate completely in water providing H+1 and Cl-1. NaOH will dissociate completely to provide Na+1 and OH-1. The Na+1 and Cl-1 will simply stay in solution as spectator ions. The net ionic neutralization reaction will then be:

Step 2 –Determine the contents of the flask using stoichiometry of the neutralization reaction (uses moles; looks like an ICE table but it is not!)
This will be a one way reaction (not an equilibrium) since the strong acid hydrogen ion is reacting with the strong base hydroxide ion. Therefore, there will not be an ice table. First, you must calculate the starting number of moles (not molarity) of H+1 and OH-1.


Then, you must use the stoichiometry of the reaction to determine the flask contents after the neutralization reaction:
| H+ | OH– | → | H2O | |
| Starting
moles |
0.0025 | 0.0010 | n/a | |
| Reacting
moles |
-0.0010 | -0.0010 | ||
| Moles after neutralization | 0.0015 | 0 |
Note there is still excess acid (before the equivalence point)
Step 3 – Determine pH of the flask contents. (this will be a calculation you learned earlier in the unit)
The 0.0015 moles of [H+] is in a new flask volume of 60.0 mL (the original 50 plus the added 10), so
![[{{H}^{+}}]=\frac{0.0015\text{ mol}}{0.0600\text{ L}}=0.025\text{ M}](https://s0.wp.com/latex.php?latex=%5B%7B%7BH%7D%5E%7B%2B%7D%7D%5D%3D%5Cfrac%7B0.0015%5Ctext%7B+mol%7D%7D%7B0.0600%5Ctext%7B+L%7D%7D%3D0.025%5Ctext%7B+M%7D&bg=ffffff&fg=000&s=0&c=20201002)
![pH=-\log [{{H}^{+}}]=-\log (0.025)=1.60](https://s0.wp.com/latex.php?latex=pH%3D-%5Clog+%5B%7B%7BH%7D%5E%7B%2B%7D%7D%5D%3D-%5Clog+%280.025%29%3D1.60&bg=ffffff&fg=000&s=0&c=20201002)
25.00 mL NaOH addition
Step 1: The net ionic neutralization reaction will be:
Step 2 –Determine the contents of the flask using stoichiometry of the neutralization reaction (uses moles; looks like an ICE table but it is not!)

Then, you must use the stoichiometry of the reaction to determine the flask contents after the neutralization reaction:
| H+ | OH– | → | H2O | |
| Starting
moles |
0.0025 | 0.0025 | n/a | |
| Reacting
moles |
-0.0025 | -0.0025 | ||
| Moles after neutralization | 0 | 0 |
The equal moles of acid and base have neutralized each other. This is the equivalence point.
Step 3 – Determine pH of the flask contents. (this will be a calculation you learned earlier in the unit)
There is no excess hydrogen ion from the acid not hydroxide ion from the base after the neutralization. The solution is neutralized and the only source of hydrogen ion is water. pH = 7.00.
30.00 mL NaOH addition
Step 1: The net ionic neutralization reaction will then be:
Step 2 –Determine the contents of the flask using stoichiometry of the neutralization reaction (uses moles; looks like an ICE table but it is not!)
First, you must calculate the starting number of moles (not molarity) of H+1 and OH-1.

Then, you must use the stoichiometry of the reaction to determine the flask contents after the neutralization reaction:
| H+ | OH– | → | H2O | |
| Starting
moles |
0.0025 | 0.0030 | n/a | |
| Reacting
moles |
-0.0025 | -0.0025 | ||
| Moles after neutralization | 0 | 0.0005 |
Now the acid is the limiting reagent, and after neutralization there are 0.0005 moles of excess strong base.
Step 3 – Determine pH of the flask contents. (this will be a calculation you learned earlier in the unit)
The 0.0005 moles of [OH–] is in a new flask volume of 80.0 mL (the original 50 plus the added 30), so
![[O{{H}^{-}}]=\frac{0.0005\text{ mol}}{0.0800\text{ L}}=0.00625\text{ M}](https://s0.wp.com/latex.php?latex=%5BO%7B%7BH%7D%5E%7B-%7D%7D%5D%3D%5Cfrac%7B0.0005%5Ctext%7B+mol%7D%7D%7B0.0800%5Ctext%7B+L%7D%7D%3D0.00625%5Ctext%7B+M%7D&bg=ffffff&fg=000&s=0&c=20201002)

and pH = 11.80
Example 14.21 in OpenStax Section 14.7 shows another example of a strong acid-strong base titration. The work is shown differently that what I have shown above, but the steps are the same.
Practice: Titration of a strong base with a strong acid
For a titration of 50.0 mL of 0.10 M NaOH with 0.10 M HCl, calculate pH for the HCl volumes indicated below:
HINT: the problem will be similar to the previous example, but there will be an excess of base before the equivalence point and an excess of acid after it.
Titration of a Weak Acid with a Strong Base
Figure 14.18 in OpenStax shows the similarities and differences between the titration of a strong acid and a weak acid with a strong base. As you can see on the titration curves, the shapes of the curves are similar. The big difference in the two curves is the equivalence point pH. The equivalence point will be reached when there are just enough moles of base added to react all the acid (1:1 if the acid is monoprotic). For the titration of a strong acid the equivalence point pH is 7. For the titration of a weak acid for a strong base, the equivalence point pH is greater than 7 (basic). Let’s look at why.
The net ionic equation of the reaction when the weak base HA is titrated with NaOH is:
The sodium ion is a spectator ion and has been omitted in the net ionic equation. At the equivalence point, the amount of hydroxide ion added is just enough to convert all of the weak acid HA to the conjugate base A–, resulting in a basic solution.
Another way of looking at it is that at the equivalence point, equal amounts of a weak acid and strong base have been combined, resulting in a basic pH. Below is a titration curve for this titration:
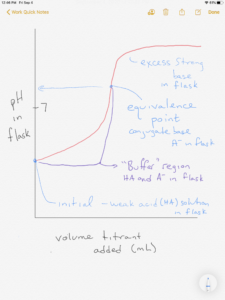
Another feature of the titration of a weak acid is the “buffer region”. Recall the neutralization reaction occurring in the titration is: 
Titration of a Weak Acid with a Strong Base – example
50.0 mL of 0.10 M HC2H3O2(aq) is titrated with 0.10 M NaOH (aq). Calculate the pH after 0.00, 10.0 mL, 25.00 mL, 50.00 mL, and 51.00 mL NaOH addition The Ka of acetic acid is 1.8 X 10⁻⁵.
0.00 mL NaOH addition – before any NaOH is added, there is 0.10 M of weak acid HC2H3O2(aq) in the flask. The pH of a weak acid solution is done using an ICE table on the dissociation reaction of the weak acid. This calculation was covered earlier in the topic Acid-base chemistry review .In fact, you were asked to calculate the pH of 0.10 M acetic acid in the objective 7 practice. The pH is 2.87.
10.00 mL NaOH addition
Just as with a strong acid/strong base titration, the three step process is used:
- Write the neutralization reaction of the titrant with the analyte
- Determine the contents of the flask using stoichiometry of the neutralization reaction (uses moles; looks like an ICE table but it is not!)
- Determine pH of the flask contents. (this will be a calculation you learned earlier in the unit)
Step 1 – Write the equation for the neutralization reaction between the acid and the base. It will be easiest to work in net ionic equations. As a weak acid, acetic acid will primarily stay together in water. NaOH will dissociate completely to provide Na+1 and OH-1. The hydroxide will act as a Bronsted Lowry base, accepting H+1 from acetic acid to form the conjugate base acetate ion. The Na+1 will simply stay in solution as spectator ions. The net ionic neutralization reaction will then be::

Step 2 –Determine the contents of the flask using stoichiometry of the neutralization reaction (uses moles; looks like an ICE table but it is not!)
This will be a one way reaction (not an equilibrium) since the strong base hydroxide ion will drive the reaction to completion. Therefore, there will not be an ice table. First, you must calculate the number of moles (not molarity) of HC2H3O2 and OH-1.


Then, you must use the stoichiometry of the reaction to determine the flask contents after the neutralization reaction:
- moles of HF and OH–.
| HC2H3O2 | OH– | → | C2H3O2– | H2O | |
| Starting
moles |
0.0050 | 0.0010 | 0 | n/a | |
| Reacting
moles |
-0.0010 | -0.0010 | +0.0010 | ||
| Moles after neutralization | 0.0040 | 0 | 0.00010 |
This will result in a buffer because acetic acid and conjugate base acetate ion are present. This is the buffer region of the titration. There is no OH-1 remaining to influence the pH.
Step 3 – Determine pH of the flask contents.
Since both the conjugate acid HC2H3O2 and the conjugate base C2H3O2 -1 are present in the solution, the pH calculation will be a buffer calculation. Recall you can calculate the pH of a buffer solution using the Ka expression of the conjugate acid, the Kb expression of the conjugate base, or the Henderson-Hasselbalch equation. Using Ka:
![{{K}_{a}}=\frac{[{{H}^{+}}][{{C}_{2}}{{H}_{3}}{{O}_{2}}^{-}]}{[H{{C}_{2}}{{H}_{3}}{{O}_{2}}]}](https://s0.wp.com/latex.php?latex=%7B%7BK%7D_%7Ba%7D%7D%3D%5Cfrac%7B%5B%7B%7BH%7D%5E%7B%2B%7D%7D%5D%5B%7B%7BC%7D_%7B2%7D%7D%7B%7BH%7D_%7B3%7D%7D%7B%7BO%7D_%7B2%7D%7D%5E%7B-%7D%5D%7D%7B%5BH%7B%7BC%7D_%7B2%7D%7D%7B%7BH%7D_%7B3%7D%7D%7B%7BO%7D_%7B2%7D%7D%5D%7D&bg=ffffff&fg=000&s=0&c=20201002)
![1.8\times {{10}^{-5}}=\frac{[{{H}^{+}}][0.0010]}{[0.0040]}](https://s0.wp.com/latex.php?latex=1.8%5Ctimes+%7B%7B10%7D%5E%7B-5%7D%7D%3D%5Cfrac%7B%5B%7B%7BH%7D%5E%7B%2B%7D%7D%5D%5B0.0010%5D%7D%7B%5B0.0040%5D%7D&bg=ffffff&fg=000&s=0&c=20201002)
Notice that the 0.0010 and 0.0040 values, which are moles, are used here in place of molarities. You may recall from the topic in Common ion and buffer solutions that that is acceptable for buffer solutions since the volumes will cancel, and the ration of moles is the same as the ratio of molarities.
7.2 X 10-5 =[H+]
pH = 4.14
25.00 mL NaOH addition
Since 25.00 mL is also before the equivalence point, the calculation will work the same as the one at 10.0 mL. Try the calculation following the same steps and see if you can do it correctly.
If you were able to work through it correctly, you may have noticed that after step 2 there were equal amounts of acetic acid and acetate ion. This occurs at a point in the titration called the half-equivalence point or midpoint, which is half of the equivalence point volume. Enough titrant has been added to convert half of the acid to its conjugate base. At that point, given
and the conjugate acid and base molarities can cancel since they are equal,
Ka = [H+] or pKa=pH.
50.00 mL NaOH addition
Step 1 – Write the equation for the neutralization reaction between the acid and the base.
Step 2 –Determine the contents of the flask using stoichiometry of the neutralization reaction (uses moles; looks like an ICE table but it is not!)

Then, you must use the stoichiometry of the reaction to determine the flask contents after the neutralization reaction:
| HC2H3O2 | OH– | → | C2H3O2– | H2O | |
| Starting
moles |
0.0050 | 0.0050 | 0 | n/a | |
| Reacting
moles |
-0.0050 | -0.0050 | +0.0050 | ||
| Moles after neutralization | 0 | 0 | 0.0050 |
This is the equivalence point. There are equal moles of weak acid and strong base and there are zero moles of each left after neutralization. All of the weak acetic acid has been converted to its conjugate base.
Step 3 – Determine pH of the flask contents.
Since all of the conjugate acid HC2H3O2 has been converted to conjugate base C2H3O2 -1 , the pH calculation will be a weak base in water. In the Acid-Base review section, you reviewed how to calculate the pH of a weak base (given its molarity) using an ICE table.
The molarity of the conjugate base will be:

since KaKb=Kw, the Kb can be calculated:

Setting up an ICE table for the conjugate base (this will be similar to the pH of the F- ion solution in Objective 12 of the Acid-Base Review):
Let’s say we wished to calculate the pH of a 0.10 M KF solution. Since KF dissociates completely, the initial F– molarity is 0.10 M. So now you can do a calculation using an ICE table just like those in Objective 7.
| C2H3O2– | H2O | ↔ | HC2H3O2 | OH– | |
| I | 0.050 | 0 | 0 | ||
| C | -x | +x | +x | ||
| E | 0.050-x | x | x |
![{{K}_{b}}=\frac{[H{{C}_{2}}{{H}_{3}}{{O}_{2}}][O{{H}^{-}}]}{[{{C}_{2}}{{H}_{3}}{{O}_{2}}^{-}]}](https://s0.wp.com/latex.php?latex=%7B%7BK%7D_%7Bb%7D%7D%3D%5Cfrac%7B%5BH%7B%7BC%7D_%7B2%7D%7D%7B%7BH%7D_%7B3%7D%7D%7B%7BO%7D_%7B2%7D%7D%5D%5BO%7B%7BH%7D%5E%7B-%7D%7D%5D%7D%7B%5B%7B%7BC%7D_%7B2%7D%7D%7B%7BH%7D_%7B3%7D%7D%7B%7BO%7D_%7B2%7D%7D%5E%7B-%7D%5D%7D&bg=ffffff&fg=000&s=0&c=20201002)

Solving for x (which is [OH–]), we get x=[OH–]=5.3 X 10⁻⁶, which results in a pH of 8.72.
51.00 mL NaOH addition
Step 1 – Write the equation for the neutralization reaction between the acid and the base.
Step 2 –Determine the contents of the flask using stoichiometry of the neutralization reaction (uses moles; looks like an ICE table but it is not!)

Then, you must use the stoichiometry of the reaction to determine the flask contents after the neutralization reaction:
| HC2H3O2 | OH– | → | C2H3O2– | H2O | |
| Starting
moles |
0.0050 | 0.0051 | 0 | n/a | |
| Reacting
moles |
-0.0050 | -0.0050 | +0.0050 | ||
| Moles after neutralization | 0 | 0.0001 | 0.0050 |
This is beyond the equivalence point. There is a mix of conjugate base (acetate ion) and excess strong base in the flask.
Step 3 – Determine pH of the flask contents.
With a mix of conjugate base (acetate ion) and excess strong base in the flask, the strong base will dominate the pH. The contribution of the acetate ion can be ignored.
The molarity of the excess strong base conjugate base will be:

therefore, [OH–] = 9.9 X 10⁻⁴ M and pH = 10.99.
Objective 20-22 Practice – titration of a weak base with a strong acid
30.0 mL of a 0.20 M solution of the weak base methylamine is titrated with 0.10 M HNO3. The Kb of methylamine is 4.4 X 10⁻⁴. Calculate the pH after 20.0 mL , 60.0 mL , and 63.00 mL acid addition.
Objective 23: Calculate the Ka for a weak acid or Kb for a weak base from titration curve data.
The Ka or Kb of a weak acid or base can be calculated from any point in the buffer region of the titration curve if the pH is known. The same three step approach to calculating pH is followed (the neutralization reaction in moles or millimoles is evaluated first). What is different is that in step 3 (after the neutralization step) the Ka or Kb is calculated given pH rather than the pH being calculated given Ka or Kb. Try the problem below.
Objective 24: Select the proper indicator for an acid-base titration.
Indicators are substances which change color with pH. The point at which the color changes is called the endpoint of the titration. The endpoint is an observable change that is used to signify the end of the titration. For a titration to be useful in analysis, the experimenter must determine the equivalence point – when just enough titrant has been added to react with all the analyte. The equivalence point is a stoichiometric point you cannot see. A well designed titration experiment minimizes titration error – the endpoint volume is as close to the equivalence point volume as possible.
Many acid base indicators are weak acids. The weak acid exhibits a different color than its conjugate base. The human eye typically sees the indicator acid color when the conjugate acid is 10 times more concentrated than the conjugate base, or sees the base color when the conjugate base is 10 times fore concentrated than the conjugate acid. Therefore, the indicator changes color over a range of pH = pKaIN +/- 1.
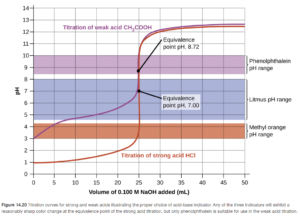
Phenolphthalein, for example, has a pKa of 8.70 and changes color from colorless to pink over a pH range of approximately 7.7 to 9.7. Ideally, an indicator will change color as close to the equivalence point as possible. Therefore, the best indicators for acid base titrations typically have a pKa as close as possible to the equivalence point pH.
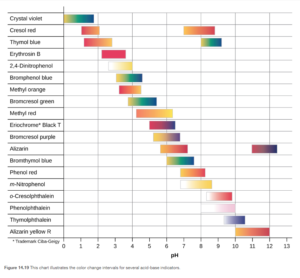
Figures 14.19 and 14.20 in OpenStax show color change ranges for many indicators and give a nice illustration of how indicator selection is important in titrations
Objective 24 practice